欢迎大家赞助一杯啤酒🍺 我们准备了下酒菜:Formal mathematics/Isabelle/ML, Formal verification/Coq/Agda, C++/Erlang/Lisp
Prometheus
来自开放百科 - 灰狐
(版本间的差异)
小 (→Grafana) |
小 (→Grafana) |
||
| 第18行: | 第18行: | ||
*[https://github.com/prometheus/alertmanager Alertmanager] | *[https://github.com/prometheus/alertmanager Alertmanager] | ||
*[https://github.com/prometheus/tsdb TSDB] | *[https://github.com/prometheus/tsdb TSDB] | ||
| + | |||
| + | ==[https://prometheus.io/docs/operating/storage/ Storage]== | ||
| + | 使用[[LevelDB]] For indexes | ||
==Grafana== | ==Grafana== | ||
2017年8月14日 (一) 02:24的版本
Prometheus 是一个开源(Apache v2)监控系统和时间序列数据库,使用 Go 语言开发。
目录 |
简介
功能
指南
$ git clone https://github.com/prometheus/prometheus.git
$ cd prometheus
$ make build
$ make test
$ make docker
$ ./prometheus -config.file=circle.yml
项目
Storage
使用LevelDB For indexes
Grafana
Promdash
Promdash 取代 Grafana,是 Prometheus 默认仪表盘。
图集
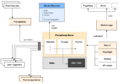
架构

链接
分享您的观点