欢迎大家赞助一杯啤酒🍺 我们准备了下酒菜:Formal mathematics/Isabelle/ML, Formal verification/Coq/Agda, C++/Erlang/Lisp
Prometheus
来自开放百科 - 灰狐
(版本间的差异)
小 (→链接) |
小 (→指南) |
||
| (未显示1个用户的8个中间版本) | |||
| 第1行: | 第1行: | ||
Prometheus 是一个开源(Apache v2)[[Monitoring|监控系统]]和[[time series database|时间序列数据库]],使用 [[Go]] 语言开发。 | Prometheus 是一个开源(Apache v2)[[Monitoring|监控系统]]和[[time series database|时间序列数据库]],使用 [[Go]] 语言开发。 | ||
| + | |||
| + | ==新闻== | ||
| + | *[http://blog.shurenyun.com/untitled-121/ 浅论Prometheus容器监控优缺点,2.0版本哪项改进受关注?] (2017.11.14) | ||
==简介== | ==简介== | ||
| 第7行: | 第10行: | ||
==指南== | ==指南== | ||
| + | $ docker run --name prometheus -d -p 127.0.0.1:9090:9090 prom/prometheus | ||
| + | http://localhost:9090/ | ||
$ git clone https://github.com/prometheus/prometheus.git | $ git clone https://github.com/prometheus/prometheus.git | ||
$ cd prometheus | $ cd prometheus | ||
| 第58行: | 第63行: | ||
==Promdash== | ==Promdash== | ||
[https://github.com/prometheus-junkyard/promdash Promdash] 取代 [[Grafana]],是 Prometheus 默认仪表盘。 | [https://github.com/prometheus-junkyard/promdash Promdash] 取代 [[Grafana]],是 Prometheus 默认仪表盘。 | ||
| + | |||
| + | ==用户== | ||
| + | *[https://promcon.io/2016-berlin/talks/the-history-of-prometheus-at-soundcloud/ The History of Prometheus at SoundCloud] | ||
| + | *[https://promcon.io/2016-berlin/talks/scaling-to-a-million-machines-with-prometheus/ Digital Ocean将Prometheus扩展到100万个虚拟机] | ||
| + | *[https://promcon.io/2016-berlin/talks/10x-improvement-for-kubernetes-performance/ CoreOS: 10x Improvement for Kubernetes Performance] | ||
| + | *[https://promcon.io/2016-berlin/talks/full-stack-metrics-with-tritons-native-prometheus-support/ Joyent: Full Stack Metrics with Triton's Native Prometheus Support] | ||
| + | *[https://promcon.io/2017-munich/talks/monitoring-cloudflares-planet-scale-edge-network-with-prometheus Cloudflare: Monitoring Cloudflare's Planet-Scale Edge Network with Prometheus] | ||
==图集== | ==图集== | ||
<gallery> | <gallery> | ||
image:prometheus-architecture.png|架构 | image:prometheus-architecture.png|架构 | ||
| + | image:Metrics-Logs-Traces.png|Metrics Logs Traces | ||
| + | image:Dcos-metrics.png|DC/OS Metrics | ||
</gallery> | </gallery> | ||
| 第70行: | 第84行: | ||
[[category:database]] | [[category:database]] | ||
| + | [[category:time series database]] | ||
[[category:monitoring]] | [[category:monitoring]] | ||
[[category:go]] | [[category:go]] | ||
2021年2月8日 (一) 03:26的最后版本
Prometheus 是一个开源(Apache v2)监控系统和时间序列数据库,使用 Go 语言开发。
目录 |
[编辑] 新闻
- 浅论Prometheus容器监控优缺点,2.0版本哪项改进受关注? (2017.11.14)
[编辑] 简介
Prometheus 是 Cloud Native Computing Foundation 成员项目,是一个系统和服务监控系统。
[编辑] 功能
[编辑] 指南
$ docker run --name prometheus -d -p 127.0.0.1:9090:9090 prom/prometheus
http://localhost:9090/
$ git clone https://github.com/prometheus/prometheus.git
$ cd prometheus
$ make build
$ make test
$ make docker
$ ./prometheus -config.file=circle.yml
[编辑] 项目
[编辑] 语言
- Prometheus Go Client
- Prometheus JVM Client
- Prometheus Python Client
- Prometheus PHP Client
- Prometheus C++ Client
- Prometheus Common Lisp Client
- Prometheus Erlang Client
- Prometheus Elixir Client
- Prometheus Node.js Client
- Prometheus metric library for Nginx written in Lua
[编辑] 输出和集成
- MySQL exporter
- PostgreSQL exporter
- MongoDB exporter
- RethinkDB exporter
- OpenTSDB exporter
- Kafka exporter
- RabbitMQ exporter
- Ceph exporter
- HAProxy exporter
- Apache exporter
- GitHub exporter
- JMX exporter
- Jenkins exporter
- PHP-FPM exporter
- Redis exporter
[编辑] Storage
使用LevelDB For indexes
[编辑] Grafana
[编辑] Promdash
Promdash 取代 Grafana,是 Prometheus 默认仪表盘。
[编辑] 用户
- The History of Prometheus at SoundCloud
- Digital Ocean将Prometheus扩展到100万个虚拟机
- CoreOS: 10x Improvement for Kubernetes Performance
- Joyent: Full Stack Metrics with Triton's Native Prometheus Support
- Cloudflare: Monitoring Cloudflare's Planet-Scale Edge Network with Prometheus
[编辑] 图集
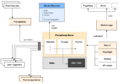
架构
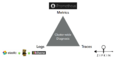
Metrics Logs Traces
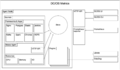
DC/OS Metrics


[编辑] 链接
分享您的观点