欢迎大家赞助一杯啤酒🍺 我们准备了下酒菜:Formal mathematics/Isabelle/ML, Formal verification/Coq/ACL2/Agda, C++/Lisp/Haskell
Grafana
来自开放百科 - 灰狐
(版本间的差异)
小 (→链接) |
小 (→链接) |
||
| (未显示1个用户的11个中间版本) | |||
| 第2行: | 第2行: | ||
==安装== | ==安装== | ||
| + | |||
| + | ==[[Zabbix]]== | ||
| + | [https://github.com/zabbix/zabbix-community-repos Grafana-Zabbix] [http://play.grafana-zabbix.org 在线演示] | ||
| + | |||
| + | ==[[Prometheus]]== | ||
| + | [http://docs.grafana.org/features/datasources/prometheus/ Using Prometheus in Grafana] | ||
| + | |||
| + | ==Kubernetes== | ||
==指南== | ==指南== | ||
| 第8行: | 第16行: | ||
<gallery> | <gallery> | ||
image:grafana-dashboard.png|仪表盘 | image:grafana-dashboard.png|仪表盘 | ||
| + | image:grafana-zabbix.png|Zabbix | ||
| + | image:kubernetes-container-dashboard-grafana.png|Kubernetes | ||
| + | image:metrictank-cassandra.png|Metrictank | ||
</gallery> | </gallery> | ||
| 第15行: | 第26行: | ||
*[http://play.grafana.org/ 在线演示] | *[http://play.grafana.org/ 在线演示] | ||
*[http://docs.huihoo.com/grafana/2.6/ Grafana 2.6文档] | *[http://docs.huihoo.com/grafana/2.6/ Grafana 2.6文档] | ||
| + | *[https://zhuanlan.zhihu.com/p/23924022 使用 StatsD + InfluxDB + Grafana 搭建 Node.js 监控系统 (一)] | ||
| + | *[https://zhuanlan.zhihu.com/p/26981364 使用 StatsD + InfluxDB + Grafana 搭建 Node.js 监控系统 (二)] | ||
| + | [[category:monitoring]] | ||
[[category:node.js]] | [[category:node.js]] | ||
[[category:go]] | [[category:go]] | ||
2017年6月2日 (五) 08:11的最后版本
Grafana 是面向 Graphite, InfluxDB & OpenTSDB 开源(Apache v2)可视化仪表盘,使用 Go 和 Node.js 开发。
目录 |
[编辑] 安装
[编辑] Zabbix
[编辑] Prometheus
[编辑] Kubernetes
[编辑] 指南
[编辑] 图集
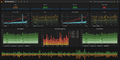
仪表盘
Zabbix
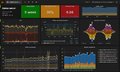
Kubernetes
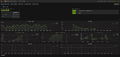
- Metrictank-cassandra.png
Metrictank


[编辑] 链接
分享您的观点