欢迎大家赞助一杯啤酒🍺 我们准备了下酒菜:Formal mathematics/Isabelle/ML, Formal verification/Coq/Agda, C++/Erlang/Lisp
InfluxDB
来自开放百科 - 灰狐
(版本间的差异)
小 (→Kapacitor) |
小 (→Kapacitor) |
||
| 第101行: | 第101行: | ||
-type stream \ | -type stream \ | ||
-tick cpu_alert.tick \ | -tick cpu_alert.tick \ | ||
| − | -dbrp mydb. | + | -dbrp mydb.default |
运行task | 运行task | ||
kapacitor record stream -name cpu_alert -duration 20s | kapacitor record stream -name cpu_alert -duration 20s | ||
2016年2月23日 (二) 09:48的版本
InfluxDB 是一个 Go 语言开发的开源(MIT)分布式时间序列数据库。
目录 |
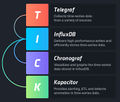
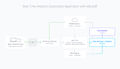
TICK堆栈
- Telegraf 数据采集
- InfluxDB 数据存储
- Chronograf 数据可视化
- Kapacitor 监控告警&ETL
应用场景
- 定制DevOps监控(Custom DevOps Monitoring)
- 实时分析(Real Time Analytics)
- 物联网和传感器数据(IoT and Sensor Data)
- 云计算(Cloud & OpenStack)
- 异常检测(Anomaly Detection)
- 消息(Messaging)
- 个性化(Personalization)
- 股票交易(Equities Trading)
- 市政基础设施管理(Municipal Infrastructure Management)
- GPS服务(GPS Services)
- 量子物理研究(Quantum Physics Research)
- POS系统(Point of Sale Systems)
- 制造业和家庭自动化(Manufacturing & Home Automation)
- 运输和物流(Transportation & Material Logistics)
指南
OS X 安装
$ brew update
$ brew install influxdb
$ brew install telegraf // 数据采集
$ brew install homebrew/binary/chronograf // 数据可视化
$ brew install kapacitor // 告警、数据处理
$ influxd
$ influx
Visit https://enterprise.influxdata.com to register for updates, InfluxDB server management, and monitoring.
Connected to http://localhost:8086 version 0.9.6.1
InfluxDB shell 0.9.6.1
> create database mydb
> show databases
> use mydb
> insert cpu,host=serverA,region=us_west value=0.64
> select * from cpu
> insert temperature,machine=unit42,type=assembly external=25,internal=37
> select * from temperature
> show series
> show measurements
> show tag keys
> show field keys
创建数据库
curl -G 'http://localhost:8086/query' --data-urlencode "q=CREATE DATABASE mydb"
插入数据
curl -XPOST 'http://localhost:8086/write?db=mydb' -d 'cpu,host=server01,region=uswest load=42 1434055562000000000'
curl -XPOST 'http://localhost:8086/write?db=mydb' -d 'cpu,host=server02,region=uswest load=78 1434055562000000000'
curl -XPOST 'http://localhost:8086/write?db=mydb'-d 'cpu,host=server03,region=useast load=15.4 1434055562000000000'
查询数据
curl -G http://localhost:8086/query?pretty=true --data-urlencode "db=mydb" --data-urlencode "q=SELECT * FROM cpu WHERE host='server01' AND time < now() - 1d"
分析数据
curl -G http://localhost:8086/query?pretty=true --data-urlencode "db=mydb" --data-urlencode "q=SELECT mean(load) FROM cpu WHERE region='uswest'"
sample数据集
curl https://s3-us-west-1.amazonaws.com/noaa.water.database.0.9/NOAA_data.txt > sample-data.txt
influx -import -path=sample-data.txt -precision=s
提示信息: 2016/02/23 10:32:35 Processed 76290 inserts
> use NOAA_water_database
> show measurements
> select count(water_level) from h2o_feet
> select * from h2o_feet limit 5
Web管理接口
http://localhost:8083/
Grafana
Grafana 是面向 Graphite, InfluxDB & OpenTSDB 可视化仪表盘。
Telegraf
Telegraf数据采集,一个插件驱动的服务器代理。
$ telegraf --help
$ telegraf -sample-config -input-filter cpu -output-filter influxdb
Chronograf
$ Chronograf
http://127.0.0.1:10000
Kapacitor
启动Kapacitor
kapacitord config > kapacitor.conf
kapacitord -config kapacitor.conf
http://localhost:9092/
Kapacitor 使用 TICKscript DSL 来定义任务(tasks)。
如:cpu_alert.tick
stream
   // 从sample数据库获得cpu测量值
   .from().measurement('cpu')
   .alert()
       .crit(lambda: "usage_idle" <  70)
       // 写入日志文件
       .log('/tmp/alerts.log')
写入task
kapacitor define \
   -name cpu_alert \
   -type stream \
   -tick cpu_alert.tick \
   -dbrp mydb.default
运行task
kapacitor record stream -name cpu_alert -duration 20s
获得数据
kapacitor list recordings $rid
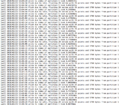
Kapacitor控制台返回的数据
[httpd] 2016/02/23 17:43:00 I! ::1 - - [23/Feb/2016:17:43:00 +0800] GET /recordings?rids= HTTP/1.1 200 134 - Go-http-client/1.1 d3f3c6e8-da11-11e5-8009-000000000000 1.44602ms
[httpd] 2016/02/23 17:43:11 I! ::1 - - [23/Feb/2016:17:43:11 +0800] GET /recordings?rids= HTTP/1.1 200 134 - Go-http-client/1.1 da323160-da11-11e5-800a-000000000000 2.339085ms
[httpd] 2016/02/23 17:43:16 I! ::1 - - [23/Feb/2016:17:43:16 +0800] GET /recordings?rids= HTTP/1.1 200 134 - Go-http-client/1.1 dd2372c5-da11-11e5-800b-000000000000 1.23626ms
[httpd] 2016/02/23 17:43:19 I! ::1 - - [23/Feb/2016:17:43:19 +0800] GET /recordings?rids= HTTP/1.1 200 134 - Go-http-client/1.1 dec4437b-da11-11e5-800c-000000000000 1.732644ms
[httpd] 2016/02/23 17:43:48 I! ::1 - - [23/Feb/2016:17:43:48 +0800] GET /recordings?rids= HTTP/1.1 200 134 - Go-http-client/1.1 f001387a-da11-11e5-800d-000000000000 1.092661ms
[httpd] 2016/02/23 17:44:05 I! ::1 - - [23/Feb/2016:17:44:05 +0800] GET /recordings?rids= HTTP/1.1 200 134 - Go-http-client/1.1 fa619ee8-da11-11e5-800e-000000000000 1.234677ms
图集
TICK堆栈
TICK堆栈
IoT
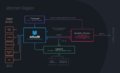
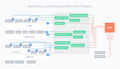
OpenStack告警日志指标管理
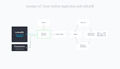
实时分析
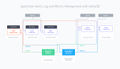
DevOps监控
WAL(Write Ahead Log)
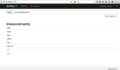
Web管理接口
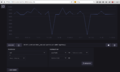
Chronograf数据可视化


链接
分享您的观点